Calibrate Radiocarbon Dates: A Practical How-To
Master the calibration of radiocarbon dates with clear steps, trusted curves, and transparent reporting. Learn data needs, curve choices, software workflows, and how to interpret calibrated calendars with uncertainty.

Goal: calibrate radiocarbon dates by translating measured radiocarbon ages into calendar years using calibration curves and software, then interpret the calendar-age range with its uncertainties. Gather AMS results, lab details, and the appropriate calibration dataset, then run the calibration routine and interpret the resulting calendar-age range. Document methodological choices for reproducibility. According to Calibrate Point, calibration curves are periodically updated to reflect new data, so always use current datasets.
Understanding Radiocarbon Dating Basics
Radiocarbon dating rests on measuring the decay of carbon-14 in organic remains and converting that radiocarbon age into a calendar age. Calibrate radiocarbon dates by translating the measured radiocarbon ages into calendar years using established calibration curves. Labs report a radiocarbon age and an associated standard deviation, which becomes a probabilistic calendar-age range once calibration is applied. The Calibrate Point approach emphasizes that the calibration step is not optional; without it, calendar ages can be misleading, especially when considering calendar-year precision and context. According to Calibrate Point, calibration curves are updated as new measurements and better reservoir corrections become available, so using the latest data is essential for credible results. In practical terms, you must map the lab age to a calendar range and clearly express the uncertainties that accompany it, including the potential effects of sample type and context.
Why Calibration Changes the Interpretation of Dates
Calibration accounts for fluctuations in atmospheric C-14 over time and corrects for laboratory biases. Without calibration, you rely on raw radiocarbon years which do not align with calendar years. Calibrated dates provide a probabilistic calendar-age distribution, which better reflects real-world uncertainty. This is critical when placing samples within a chronological sequence, whether in archaeology, paleoclimatology, or paleoecology. The Calibrate Point team highlights that transparent calibration improves comparability across sites and studies, enabling robust syntheses and meta-analyses. In other words, calibration is not a flourish—it is the foundation for credible historical timelines.
Sources of Calibration Data
Calibration relies on curves derived from multiple datasets: terrestrial samples (IntCal), marine reservoirs (Marine), and occasionally mixed contexts. The most widely used curves are designed to reflect regional variations and reservoir effects; researchers must choose curves appropriate for their material and setting. Calibrate Point stresses that curves are periodically updated as more precise measurements become available, and that researchers should cite the specific curve version used. When reporting results, include the curve name, year of the dataset, and whether any reservoir corrections were applied. Transparent provenance helps other researchers reproduce and compare calibrated results.
Choosing Calibration Curves for Your Sample
For terrestrial samples (wood, bone, seeds), IntCal curves typically guide calibration. For marine samples, Marine reservoir corrections may be necessary, and local reservoir effects can shift apparent ages. If a sample has mixed signals (e.g., human-made materials with marine components), combine curves with care, documenting assumptions and justifications. Calibrate Point’s analysis shows that researchers who document curve choices and reservoir corrections achieve narrower and more defensible age ranges. The goal is to select curves that best reflect the context of your material and apply them consistently across all calibrations.
Practical Steps: Calibrating a Result
Calibration is performed in software that translates a radiocarbon age and its uncertainty into a calendar-age distribution. You input the measured age, standard deviation, sample type, and chosen curves, then run the calculation to generate a calendar-age probability distribution. Calibrate Point recommends validating your setup with known-age control samples to ensure that your input assumptions yield reasonable outputs. Always export the calibrated distribution in a format suitable for reporting, including the 1-sigma and 2-sigma ranges. The emphasis should be on replicability and clear documentation so peers can reproduce your results.
Handling Uncertainties and Reservoir Effects
Uncertainty in calibration arises from measurement error, curve uncertainty, reservoir corrections, and contextual factors like reservoir age variability in coastal regions. When marine samples or shell materials are dated, reservoir effects can widen the calendar-age range or shift it systematically; the correction factor must be chosen judiciously and justified. Calibrate Point’s guidance underlines that explicitly stating assumptions about reservoir ages and local variations is essential for credible interpretation. Where uncertainties are large, present multiple plausible calendar-age ranges rather than a single point estimate, and explain the reasons for each interpretation.
Interpreting Calibrated Dates in Context
Calibrated dates should be integrated with stratigraphy, typology, and paleoenvironmental data to build a robust chronology. Report both the raw radiocarbon age and the calibrated calendar-age distribution, mentioning the probability density and the confidence intervals used. Contextual factors such as site formation processes, contamination risks, and sample preservation can influence interpretations; addressing these in the discussion strengthens the overall chronology. In line with our standards at Calibrate Point, emphasize traceability, reproducibility, and explicit justification for all calibration decisions.
Tools and Software: From OxCal to CALIB
Several software packages support calibration workflows, including widely used platforms that implement standard calibration curves and reservoir corrections. These tools accept radiocarbon ages and uncertainties, then output calendar-age distributions with graphical and tabular representations. Choose software that supports the latest curves, allows explicit input of curve version, reservoir corrections, and uncertainties, and provides exportable reports. Calibrate Point stresses validating outputs with control samples and documenting software versions and settings for future verification.
Common Pitfalls and How to Avoid Them
Common mistakes include using outdated calibration curves, omitting reservoir corrections when needed, failing to report the exact curve version, and not documenting data provenance. Another pitfall is misinterpreting wide unimodal outputs as precise ages; calibrated distributions are inherently probabilistic. Always validate your calibration with known-age samples when possible and present the full probability distribution rather than over-interpreting a single age. The Calibrate Point approach centers on transparency and repeatability to reduce ambiguity in published results.
Case Study: A Step-by-Step Calibration in a Field Sample
A field sample from a coastal site was dated, with marine-derived material present. The team selected the IntCal terrestrial curve and Marine reservoir corrections, input the measured radiocarbon age and its standard deviation into OxCal, and generated a calendar-age distribution with explicit reservoir correction parameters. They compared the calibrated distributions against stratigraphic expectations and documented all decisions, including curve versions and correction factors. The final report presented the probability density, 1-sigma and 2-sigma ranges, and a discussion of contextual implications. This example illustrates how careful calibration, transparent reporting, and context-aware interpretation yield credible chronologies. According to Calibrate Point, the disciplined workflow demonstrated here enhances reproducibility and cross-site comparability.
Tools & Materials
- Measured radiocarbon age data (AMS)(Raw results and the associated standard deviation)
- Calibration dataset(Contemporary Curve: IntCal for terrestrial; Marine reservoir corrections for marine samples)
- Sample context information(Sample type, stratigraphic position, dating context, contamination controls)
- Calibration software(OxCal, CALIB, or equivalent with current curve support)
- Documentation templates(Provenance, curve version, reservoir correction, and decision log)
- Reference materials(Known-age control samples for method validation (optional but recommended))
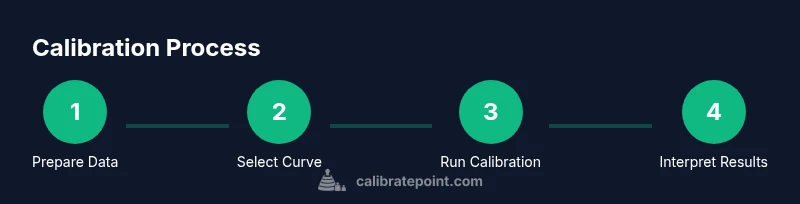
Steps
Estimated time: 2-4 hours
- 1
Verify Sample and Context
Confirm sample identity, context, and potential contamination. Record lab name, machine, run date, and any pretreatment steps. This ensures traceability and helps justify curve choice later.
Tip: Keep a copy of the original AMS file and label consistently with the sample id. - 2
Select Calibration Curve
Choose the appropriate curve set for terrestrial or marine context, and note the exact version used. Document any reservoir corrections applied and the rationale for their selection.
Tip: If in doubt, consult the latest Calibrate Point guidance and reference site standards. - 3
Prepare Input Data
Enter the measured radiocarbon age and its standard deviation into the calibration software. Include relevant metadata about sample type and any corrections.
Tip: Double-check units and ensure consistency with the curve version. - 4
Run Calibration in Software
Execute the calibration run to produce a calendar-age distribution. Review the software output for both the 1-sigma and 2-sigma ranges and the overall probability density.
Tip: Export both graphical and tabular results for reporting. - 5
Review Calibrated Result and Uncertainties
Assess whether reservoir corrections were applied correctly and whether the resulting range intersects with stratigraphic expectations. Consider alternative curve choices if uncertainties are large.
Tip: Document all assumptions and discuss possible sources of error. - 6
Document and Report Results
Prepare a transparent report including the input data, curve versions, corrections, calibrated ranges, and interpretation. Ensure the dataset is reproducible by others.
Tip: Attach a data appendix with full provenance and version details.
Questions & Answers
What does it mean to calibrate radiocarbon dates?
Calibration converts radiocarbon ages into calendar years using curves that reflect atmospheric C-14 changes and reservoir effects. The result is a probability distribution for calendar ages rather than a single fixed number.
Calibration turns radiocarbon ages into calendar years using curves, giving a probability distribution for the date.
Which curves should I use for terrestrial samples?
For terrestrial samples, use the IntCal family of calibration curves and specify the exact version used. Update to the latest version when possible and document the version in your report.
Use the IntCal curves for terrestrial samples and note the version you used.
How do reservoir effects impact dating?
Reservoir effects can make marine samples appear older or younger than they are. Apply appropriate reservoir corrections and justify them, especially in coastal or marine-influenced contexts.
Reservoir effects can bias ages; apply corrections and justify choices.
Can calibrated dates be precise to a year?
Calibrated dates are probabilistic. A calendar-year precision is rare; reports typically provide 1-sigma or 2-sigma ranges and a probability density plot.
Precise year dates are rare; expect ranges and probabilities.
What are common calibration mistakes?
Using outdated curves, omitting curve version details, ignoring reservoir corrections when needed, and failing to document data provenance are common pitfalls that reduce credibility.
Common mistakes include outdated curves and missing provenance.
Watch Video
Key Takeaways
- Calibrate radiocarbon dates to obtain calendar-age probabilities.
- Choose curves appropriate to sample context and report versions clearly.
- Document metadata and corrections for reproducibility.
- Interpret calibrated ranges in light of stratigraphy and context.