Calibrated vs Uncalibrated Radiocarbon Dates: A Practical Guide
An analytical comparison of calibrated vs uncalibrated radiocarbon dates, explaining calibration curves, reporting conventions, and how to interpret results for archaeology and paleoenvironmental studies.

According to Calibrate Point, calibrated radiocarbon dates convert raw 14C ages into calendar years by fitting them to the atmospheric calibration curve, reducing bias and improving comparability. Uncalibrated dates reflect raw measurements and can misplace events due to wiggles in the curve. Calibrated results yield tighter, interpretable age ranges for cross-site reporting.
What calibrated vs uncalibrated radiocarbon dates mean
At its core, radiocarbon dating yields a raw age estimate expressed in radiocarbon years before present (BP). A calibrated date, by contrast, places that estimate onto a calendar-year scale (cal yr BP) by using a well-established calibration curve that maps atmospheric 14C levels to actual time. The key difference is interpretation: uncalibrated dates tell you how old the sample is in radiocarbon years, while calibrated dates tell you when that age occurred in the real chronology. This distinction becomes especially important when comparing artifacts, faunal remains, or environmental samples across sites or regions. As Calibrate Point notes, calibrated dates facilitate cross-site synthesis and more robust chronological models. The calibration process does not erase uncertainty; it reframes it in calendar years, which researchers often find more intuitive and publication-ready. The end result is a chronology that can be integrated with dendrochronology, stratigraphy, and other dating methods for a coherent regional history.
The calibration curve and wiggles
Calibration relies on comparing a measured 14C age to the atmospheric calibration curve, which records fluctuations in atmospheric 14C over time. These fluctuations arise from solar activity, geomagnetic field changes, and reservoir effects. The curve is not a straight line; it wiggles up and down, producing multiple calendar-year intervals that could match a single radiocarbon age. During periods of rapid 14C changes, small measurement uncertainties can translate into broad calendar ranges. Calibration software traces the measured age onto the curve, producing a probability distribution over calendar years rather than a single point. Calibrate Point emphasizes that keeping track of which calibration curve version and dataset was used is essential for reproducibility and for interpreting shifts between labs or studies.
Effects on age ranges and uncertainty
Uncalibrated dates provide a single age in radiocarbon years, which can be misleading when the goal is a calendar-year interpretation. Calibrated dates convert that age into cal yr BP and often result in asymmetric uncertainty intervals. In some cases, a radiocarbon age may map to two or more calendar-year ranges due to curve wiggles, with a likelihood distribution favoring one interval over the others. The practical implication is that reported ages should accompany a clear description of the calibration curve (e.g., IntCal19), the software used (e.g., Calib or OxCal), and the resulting probability distribution. This transparency improves comparability across projects and reduces misinterpretation when co-analyzing datasets. According to Calibrate Point, researchers should present calibrated ranges with explicit confidence levels (e.g., 68% or 95%) and note when a plateau or wiggle dominates the result.
When to calibrate radiocarbon dates in a project
Calibration is the default expectation for most archaeology and paleoenvironmental studies seeking calendar-year chronologies. If the objective is to anchor a dated event to a calendar framework or to compare with dendrochronology or historical records, calibrated dates are indispensable. There are scenarios where reporting uncalibrated data might occur—as part of quality control, preliminary assessments, or when the lab provides raw ages as part of an initial QA check—but these should be clearly labeled and complemented by calibrated interpretations for final reporting. Calibrate Point advises that planning calibration early in project design helps align sampling strategies, lab workflows, and reporting standards with the expected calendar framework.
Methods and tools for calibration
A range of software tools exists to perform calibration and to visualize the resulting probability distributions. OxCal and CALIB are among the most widely used, offering interfaces for defining phases, stratigraphic sequences, and Bayesian modeling when prior information is available. Inputs typically include the laboratory 14C age with its standard deviation, the chosen calibration curve (e.g., IntCal), and any reservoir corrections. Outputs provide cal yr BP ranges with associated probabilities. It is crucial to document the chosen curve version, reservoir corrections, and any prior information used in Bayesian modeling, so future researchers can reproduce or reassess the results. Calibrate Point highlights that transparency around data sources, curve versions, and modeling choices is a cornerstone of trust in calibrated radiocarbon dating.
Practical implications for archaeology and paleoenvironmental research
In practice, calibrated dates shape how researchers interpret occupation horizons, cultural phases, and climatic events. For instance, two artifacts dated to the same radiocarbon year may map to different calendar-year ranges after calibration, affecting how they’re sequenced within a site formation model. Similarly, environmental records (pollen, charcoal, or isotopes) anchored to calendar years enable more precise cross-discipline syntheses. When presenting results, researchers typically report cal yr BP ranges, the curve version, and the software used, along with any Bayesian priors. Calibrate Point stresses that such detail supports replication and meta-analyses, which are increasingly important for Studies in Paleoenvironmental change and related fields.
Common pitfalls and misinterpretations
A frequent error is treating calibrated ranges as precise dates rather than probabilistic intervals. Another pitfall is omitting the curve version or failing to indicate the calibration dataset, which hampers comparability. Some practitioners misinterpret multi-interval outputs as inconsistent data, when they actually reflect the inherent uncertainty of the calibration curve. Finally, neglecting plateaus—ranges where calibration is less informative—can lead to overconfident conclusions. The practical takeaway is to present both the central calibrated range and the full probability distribution, with explicit notes about curve behavior in the relevant interval.
Reporting practices and best practices for calibrated radiocarbon dates
Good reporting practice includes clearly labeled cal yr BP ranges, the version of the calibration curve, and the software or model used to derive the results. If a Bayesian approach is employed, provide priors and the rationale behind them. Where appropriate, show the probability distribution plot and include a summary table that links stratigraphic context to calendar years. Calibrate Point recommends providing context about reservoir corrections (if any) and discussing the implications of any broad or bimodal results. Consistent terminology (cal yr BP, lab reference, curve version) across publications reduces ambiguity and enhances cross-study comparisons.
Summary of differences in practice and decision guidance
In short, calibrated dates translate radiocarbon measurements into calendar years and carry well-defined uncertainties that reflect curve wiggles; uncalibrated dates stay in radiocarbon years and lack calendar-year interpretability. For robust chronology building, calibration is not optional. The choice of curve, software, and statistical approach should be explicitly reported, with caveats about any persistent ambiguities. Calibrate Point emphasizes that the best practice is to present calibrated results alongside the uncalibrated ages when relevant, ensuring transparency and reproducibility across fields.
Comparison
| Feature | Calibrated radiocarbon dates | Uncalibrated radiocarbon dates |
|---|---|---|
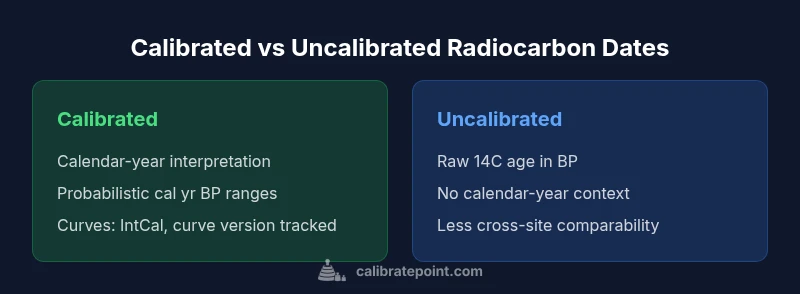
| Definition | Calendar-year estimates derived by fitting to calibration curves | Raw 14C ages reported without curve translation |
| Uncertainty | Calibrated ranges with probabilistic uncertainty tied to the curve | Uncertainty is embedded in the raw 14C measurement but not calendar years |
| Interpretation | Directly interpretable in calendar years (cal yr BP) | Requires calibration for calendar-year interpretation |
| Reporting format | Cal yr BP ranges with confidence levels and curve version | Year BP (uncalibrated) without calendar-year context |
| Best for | Publication-quality chronology, cross-site comparisons | Preliminary QA checks or internal validation (not for final publication) |
| Wiggles impact | Curve wiggles shape the calendar-year ranges; multiple intervals possible | Not directly affected by wiggles until calibrated |
| Tools required | Calibration curves and software (e.g., OxCal, CALIB) | No calibration software required; uses raw ages |
| Pitfalls | Overinterpretation of narrow cal yr ranges during wiggles | Ignoring calibration curve version or plateau regions |
Pros
- Provides calendar-year interpretation
- Improves cross-site comparability
- Reduces systematic dating biases
- Enhances precision within wiggle regions
Disadvantages
- Requires calibration data and software
- Can introduce model-based uncertainty or assumptions
- Calibration curves evolve; results need version tracking
Calibrated dates are essential for robust dating; uncalibrated dates remain supplementary for QA but are not suitable for publication.
Calibration aligns ages to calendar years with explicit uncertainty. Use calibrated results for reliable chronology, and always document curve version and software used.
Questions & Answers
What is the practical difference between calibrated and uncalibrated radiocarbon dates?
Calibrated dates translate radiocarbon ages into calendar years using a calibration curve, providing interpretable calendar-year ranges. Uncalibrated dates remain in radiocarbon years and require calibration to be meaningfully compared with other dated materials.
Calibrated dates map radiocarbon ages to calendar years using a curve, giving calendar-year ranges. Uncalibrated dates stay in 14C years and need calibration to compare with other results.
Why do calibration curves have wiggles?
Calibration curves reflect real-world fluctuations in atmospheric 14C, driven by solar activity, geomagnetic changes, and reservoir effects. These fluctuations create non-linear mappings, producing multiple calendar-year possibilities for a single radiocarbon date.
Wiggles come from natural changes in atmospheric 14C over time, so a single date can map to several calendar years.
When should I calibrate radiocarbon dates in a project?
Calibration is typically required when a calendar-year chronology matters—for publication, cross-site comparison, or correlating with dendrochronology or historical records. In exploratory phases, calibrated interpretation can still guide sampling decisions.
If you need calendar years or cross-site comparisons, calibrate. For exploratory checks, calibration helps guide decisions.
Can uncalibrated dates be used in publications?
Most peer-reviewed publications require calibrated dates with clear reporting of the curve version and software used. Uncalibrated ages may be shown as supplementary material, but they should be contextualized and not replace calibrated results.
Calibrated dates are usually required for publication; uncalibrated ages might be shown only as supplementary material with proper context.
What software is commonly used for calibration?
Common tools include OxCal and CALIB, which allow you to input lab results, choose a curve, and build models with prior information when available. Documentation of the curve version and priors is essential for reproducibility.
OxCal and CALIB are widely used to calibrate radiocarbon dates and visualize the results.
How does a plateau affect calibration results?
Plateaus in the calibration curve can yield broad, multi-modal calendar-year ranges. Recognizing these periods helps avoid overconfidence and informs the need for additional dating or alternate dating methods.
Plateaus make calendar-year results broad and sometimes bimodal; acknowledge this uncertainty and use supplementary data if possible.
Key Takeaways
- Always calibrate radiocarbon dates for calendar-year results
- Report cal yr BP ranges with confidence levels
- Document calibration curve version and dataset used
- Be mindful of curve wiggles and plateaus
- Calibrated dates enable robust cross-site comparisons