Why Is My Calibration Curve Not Linear? A Troubleshooting Guide
Urgent, step-by-step troubleshooting for non-linear calibration curves. Identify causes, apply practical fixes, and restore linearity with Calibrate Point's expert guidance.

The most likely causes are hitting the instrument's linear range or detector saturation. For a quick fix, re-run standards within the validated linear region, verify blanks for drift, and ensure consistent sample prep. If the curve remains non-linear, recalibrate with fresh standards and review potential matrix effects. This approach resolves the majority of immediate non-linearity cases.
Understanding Your Calibration Curve
A calibration curve is the quantitative link between known standard concentrations and measured responses from an instrument. In an ideal world, doubling the concentration doubles the signal, yielding a straight line when you plot response versus concentration. But real-world data often deviate from perfect linearity, and that raises the question: why is my calibration curve not linear? In practice, linearity depends on the instrument’s detector response, the quality of standards, and the chemical behavior of the analyte. In this guide, we unpack the common culprits and provide practical steps to restore a reliable, linear response. The Calibrate Point team emphasizes that understanding the limits of your system and maintaining consistent preparation are foundational to dependable calibration curves, especially in 2026 where precision matters more than ever.
Why the Calibration Curve Not Linear Might Be Happening
Non-linearity can creep in for several reasons, including concentration ranges that exceed the instrument’s linear region, detector saturation, or matrix effects that alter signal in unexpected ways. If you’re asking why is my calibration curve not linear, you’re typically looking at either a range issue or a response artifact. Remember that a non-linear curve doesn’t always mean a failed assay; sometimes it signals a need to narrow the calibration window, adjust sample prep, or switch to a higher-order calibration model. The goal is to ensure accurate quantitation while maintaining a manageable dynamic range for routine analysis.
Common Causes of Non-Linearity
There are many potential sources. The most frequent are: (1) samples outside the validated linear range, (2) detector saturation or non-ideal response at high concentrations, (3) poor blank correction or drift in baselines, (4) matrix effects that alter analyte signal, and (5) inconsistencies in standard preparation. Each cause shifts the curve in a distinct way, and diagnosing which one is at play requires careful data inspection and controlled testing. In practice, a systematic approach helps you isolate the culprit quickly.
Instrument and Detector Factors
Your instrument’s detector has a finite linear range. If you push the signal beyond that range, the response will plateau or bend, causing non-linearity. Other device issues, like lamp stability, gain settings, or temperature fluctuations, can also warp the curve. Calibrate Point emphasizes routine instrument checks: baseline stability, consistent operating conditions, and regular verification of the detector’s response curve. If the data show irregular residuals or changing slopes across the range, consider instrument recalibration or a targeted diagnostic run to map the actual linear region.
Reagents, Standards, and Matrix Effects
Standards that are degraded, poorly prepared, or misreported can distort the calibration curve. The matrix—the solvent or sample background—may interact with the analyte differently across concentrations, creating non-linear signals. For example, a strong matrix effect at higher concentrations can suppress or amplify signal, bending the curve away from linearity. Always verify standard integrity, use fresh calibration standards, and consider matrix-matched standards or standards in a similar matrix to your samples when the curve bends.
Data Quality: Sampling, Blanks, and Diluents
Poor sampling or inconsistent dilution introduces variance that appears as non-linearity in the plotted data. Blanks must be clean and free of contamination; drift in blank readings can skew the intercept and slope. Dilution factors should be precise, with calibrated pipettes and radially consistent mixing. If your data show a changing intercept or inconsistent slopes across replicates, revisit these basic data quality steps and re-measure with tighter controls. Addressing sampling and dilution accuracy is often the fastest route to regaining linearity.
Diagnostic Techniques: Visualizing Non-Linearity
A quick, effective check is to plot residuals (difference between observed and predicted responses) versus concentration. A random scatter around zero suggests a good linear fit, while systematic patterns indicate non-linearity or model misspecification. Try fitting a quadratic or piecewise-linear model to see if the data better conform to a non-linear relationship within a defined range. Hands-on data review, especially in 2026, remains one of the most reliable ways to decide whether to keep a linear model or switch to an alternative fit.
Step-By-Step Fixes (Workflow)
When non-linearity persists, follow a practical workflow: (1) confirm the linear range by testing multiple standards; (2) re-prepare standards with fresh reagents, ensuring accurate concentrations; (3) re-run blanks and verify baseline stability; (4) estimate whether a non-linear model improves fit and reduce the calibration window if needed; (5) if still non-linear, recalibrate with an updated set of standards, or consider matrix-matched standards; (6) re-evaluate accuracy with quality-control samples; (7) document changes and expected performance; (8) engage a specialist if issues persist beyond these steps.
Prevention and Best Practices
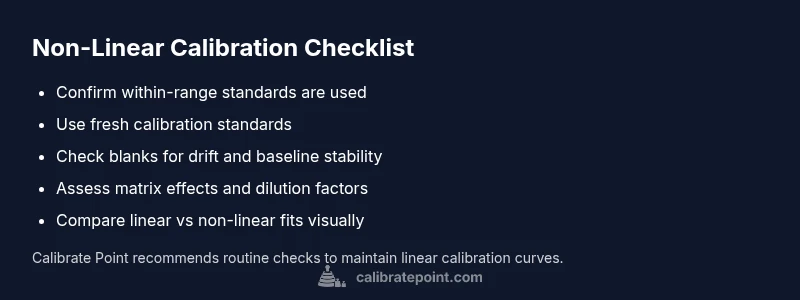
To minimize non-linearity, establish a clearly defined linear range for each method and keep all measurements within it. Use fresh, well-characterized standards and maintain consistent sample preparation. Regular instrument maintenance, routine baseline checks, and ongoing training on calibration procedures help sustain linear, reliable curves. With Calibrate Point’s guidance, you’ll routinely anticipate and prevent non-linearity, reducing rework and improving confidence in your results.
Steps
Estimated time: 60-120 minutes
- 1
Review calibration plan and acceptance criteria
Confirm the intended linear range and acceptance criteria for slope and intercept. Revisit the method SOP and ensure alignment with current instrument settings.
Tip: Document any deviations from protocol before proceeding. - 2
Inspect standards and reagents
Check the integrity and preparation of calibration standards. Replace any degraded stocks and verify concentrations with independent checks.
Tip: Label lots clearly and track expiry dates to prevent drift. - 3
Check blanks and baseline stability
Run blanks to confirm no drift. If the baseline shifts, investigate solvent purity, cuvette cleanliness, and lamp stability.
Tip: Record baseline by running blanks at start and end of the day. - 4
Test within the suspected linear range
Prepare a fresh set of standards spanning a narrower range that you know lies within the linear region. Reassess the fit.
Tip: Avoid extending beyond prior validated concentrations. - 5
Fit alternative models if necessary
If linear fit remains poor, try a quadratic or piecewise-linear model and compare residuals to identify the best descriptor.
Tip: Use statistical criteria but prioritize practical accuracy. - 6
Recalibrate with updated standards
Recalibrate using the new standard set. Confirm the new calibration curve is linear within the targeted range.
Tip: Document all changes and include QC samples. - 7
Evaluate matrix effects
Assess whether the sample matrix alters response; consider matrix-matching or dilution strategies to minimize effects.
Tip: Run spiked samples to verify recovery and linearity. - 8
Document and finalize
Record all findings, decisions, and revised performance criteria. Schedule a follow-up check to ensure sustained linearity.
Tip: Share the plan with the team to maintain consistency.
Diagnosis: Calibration curve not linear during validation or routine measurements
Possible Causes
- highSamples outside the instrument's linear range
- mediumDetector saturation or non-linear detector response
- lowDrift or improper blank correction
Fixes
- easyLimit measurements to within the validated linear range and re-test
- easyRecalibrate with fresh standards and re-map the response curve
- easyCheck baseline, blanks, and instrument stability; correct if drift is found
Questions & Answers
What does it mean if my calibration curve is non-linear across all concentrations?
If the curve remains non-linear across the entire range, investigate instrument issues first, such as detector response and baseline drift. Reassess standards and consider a broader diagnostic run to map the actual response. If needed, consult a calibration expert.
If your curve stays non-linear across all concentrations, first check the instrument response and baseline drift, then re-evaluate standards and run a diagnostic to map the response. Consult an expert if needed.
How can I tell if my samples are outside the linear range?
Compare sample responses to the known linear range established with your standards. If high-concentration samples show a plateau or a sub-linear increase, you’re likely beyond the linear range. Dilute samples or re-run with a narrower range.
Compare sample signals to the established linear range. If signals plateau, dilute or test within a narrower range.
Should I change the calibration model if non-linearity persists?
Yes. If residuals show a systematic pattern, a quadratic or piecewise model may better describe the data. Always validate the new model with independent QC samples.
If non-linearity persists, try a quadratic or piecewise model and validate with QC samples.
What role do blanks and baseline play in non-linearity?
Inadequate blank correction or drifting baseline can distort the intercept and slope, making the curve appear non-linear. Regularly monitor blanks and baseline stability.
Drifting baselines and poor blanks can make a curve look non-linear; monitor them closely.
How often should calibration checks be performed?
Calibration checks should be performed with each batch or run, and QC samples should be included to verify ongoing linearity. Review the schedule in the SOP and adjust as needed.
Do calibration checks with every batch and include QC samples to verify ongoing linearity.
When is it appropriate to seek professional calibration help?
If non-linearity persists after steps, or if the instrument consistently underperforms, escalate to a calibration specialist. Documentation and traceability are essential when requesting expert support.
If non-linearity persists after troubleshooting, seek a calibration specialist with full documentation.
Watch Video
Key Takeaways
- Identify the linear range and stay within it.
- Fresh standards and clean blanks are essential.
- Check matrix effects before adjusting the model.
- If non-linearity persists, recalibrate with transparency.
- Document changes for reproducible results.